Run the learning platform
Notice a pattern across reflections.
Profile distributions and lesson-linked timelines describe submitted answers, without treating them as a validated diagnosis.
A selected response set
Illustrative questionnaire data, separate from the classroom activity counts.
- Responses in this example
- 24
- First responses
- 18
- Repeated responses
- 6
Profiles summarize configured answers. They are not a validated psychological assessment, and a rising score is not proof of improved learning.
What this part of Arc does
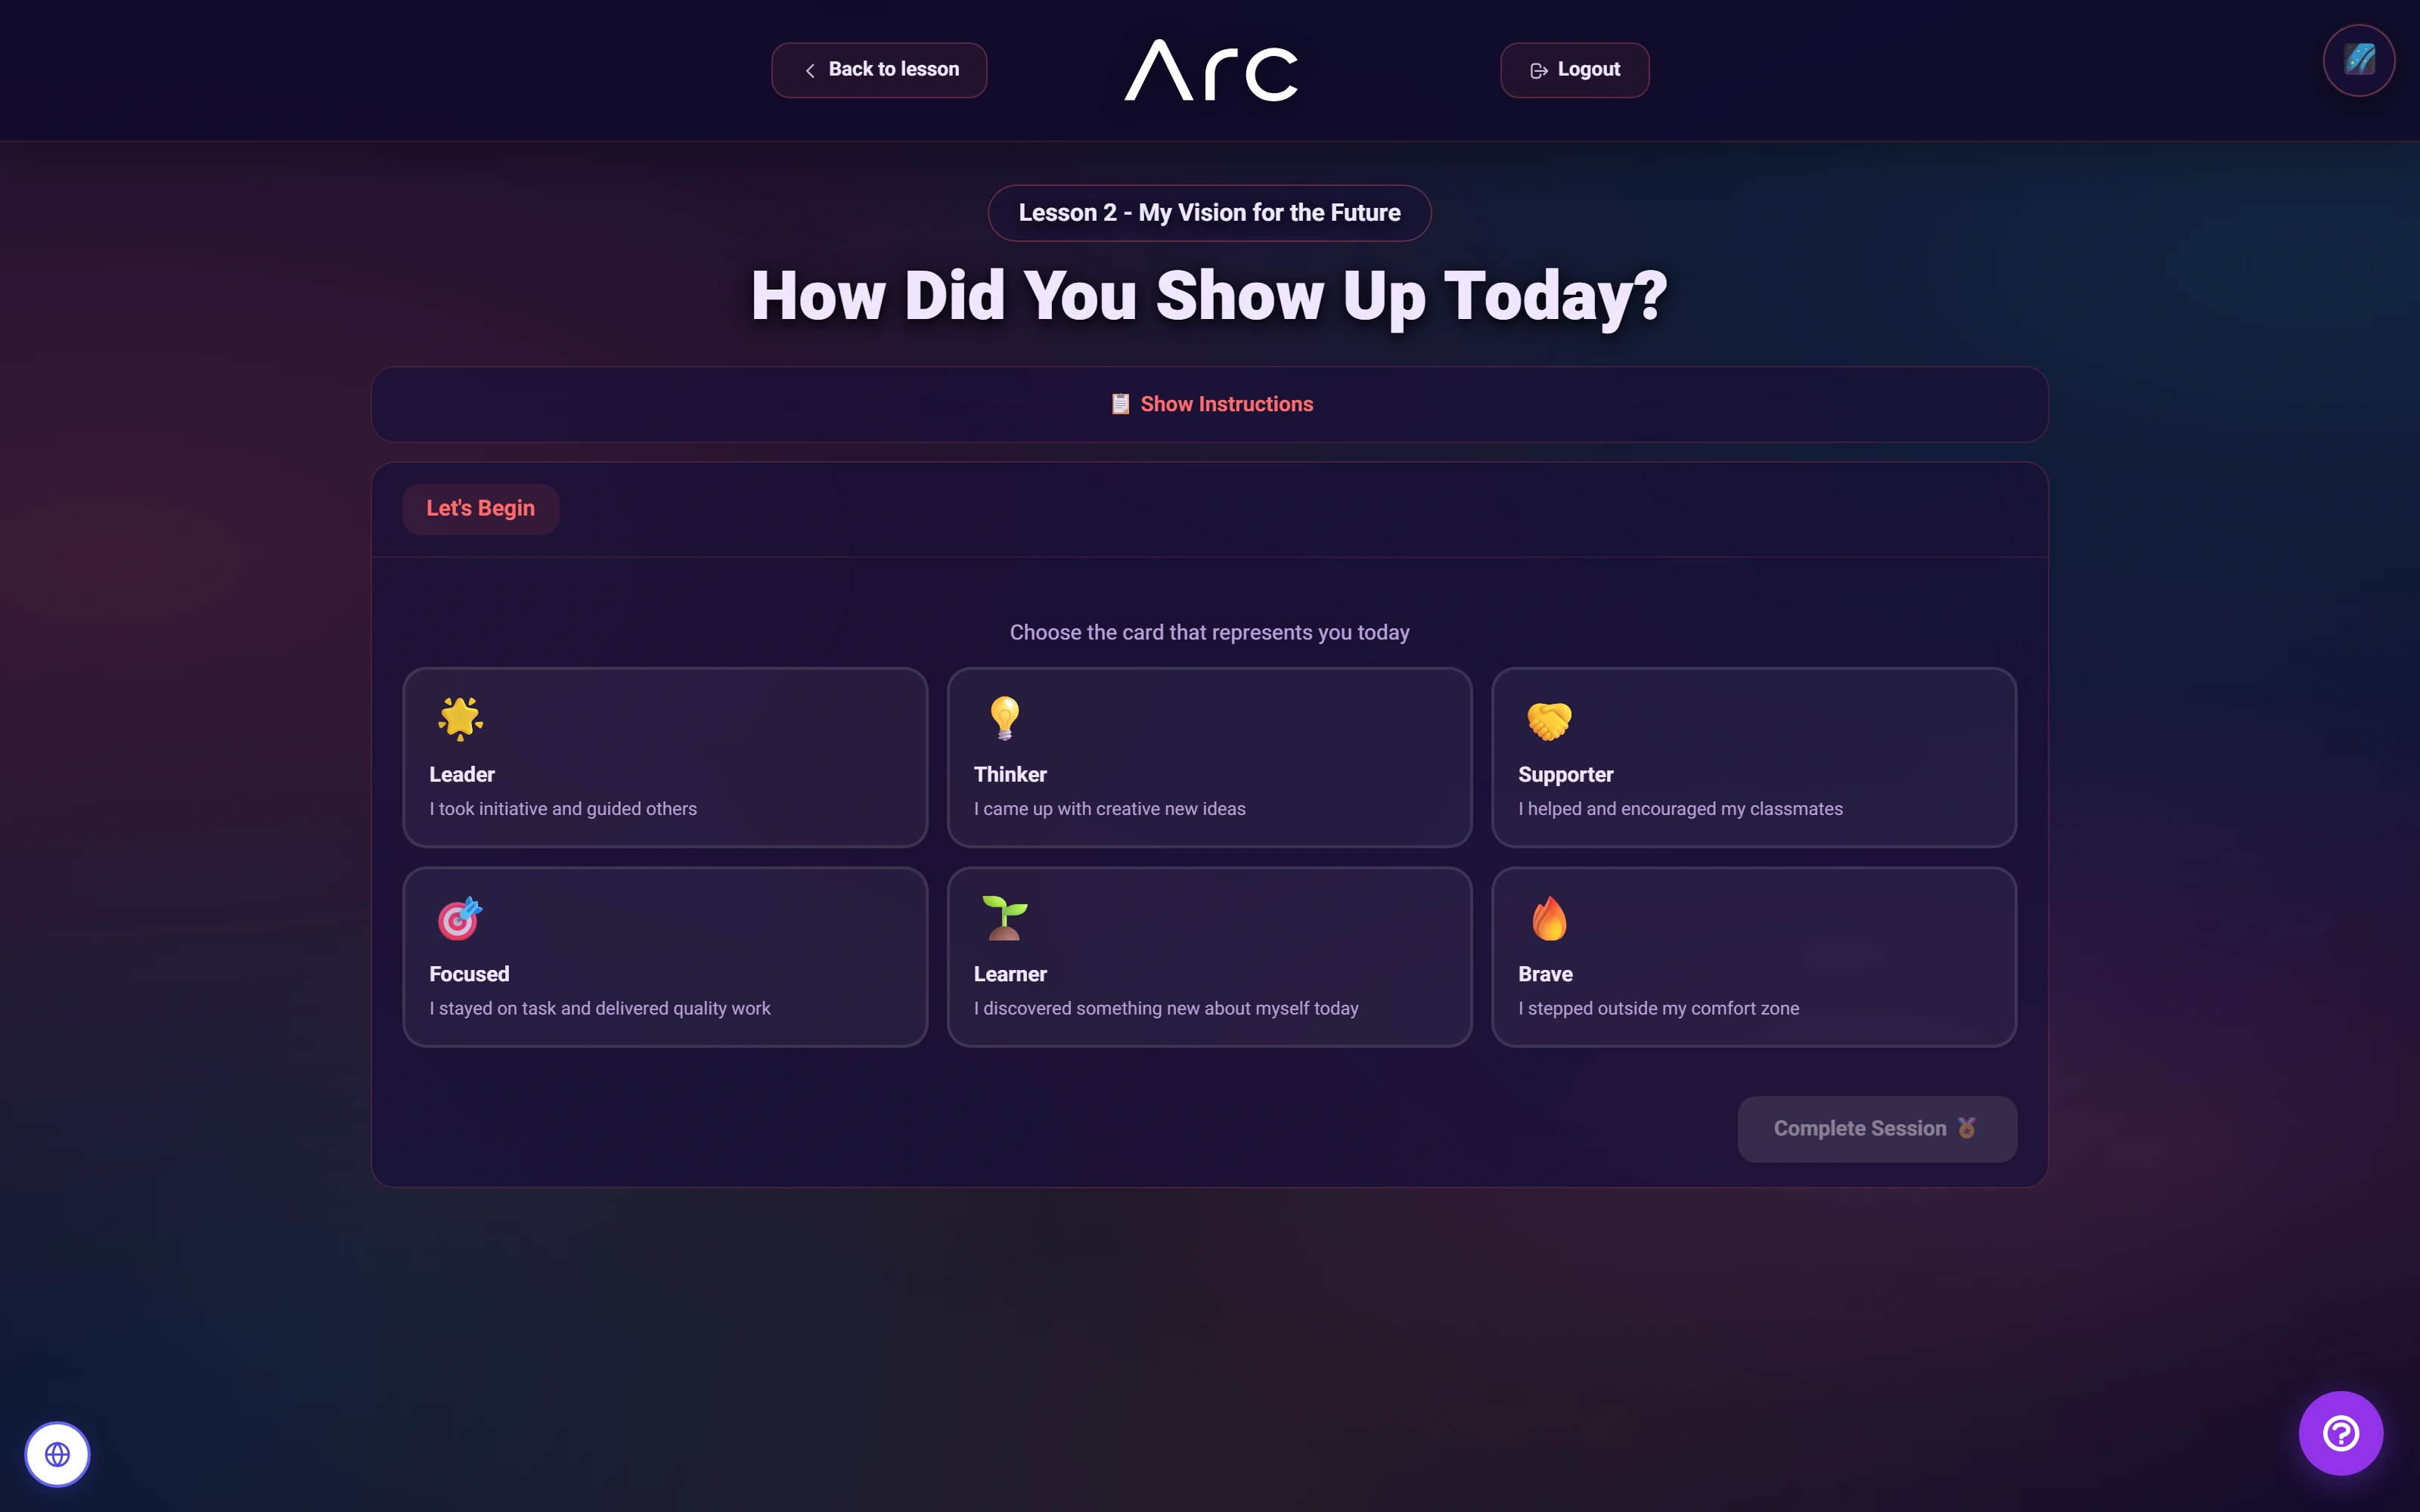
- Reflection counts, type distributions and profile pairs
- Breakdowns by lesson and program
- Individual student timelines and repeated reflections
This is a browsable portfolio interpretation of Arc’s workflows with fictional examples. Navigation, filtering and theme previews work here; editing, execution and platform services belong to the original application.
Inside the original application.
Real Arc screens and recordings, captured locally with fictional people and work.
Source references & review notes
app/Platform/Portals/Admin/Controllers/AdminReflectionAnalyticsController.phpapp/Platform/Domain/Questionnaire/ReflectionAnalyticsService.php
Source reviewed at development revision 5549bf96. Original captures have their own pinned revisions; the live platform has a separate release.